Slaying the inflation dragon is proving to be difficult.

Many people feel a disconnect between the headline CPI number and their own personal reality. To bring clarity to a sometimes-confusing topic, we turn to our Optimus Inflation Composite, which consists of four separate U.S. Bureau of Labor Statistics’ inflation gauges.
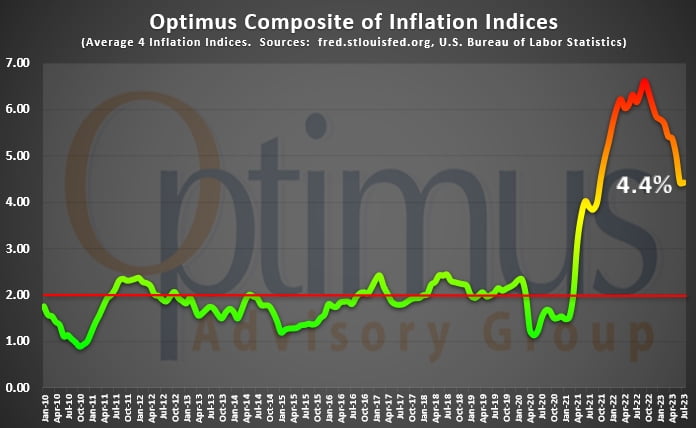
Our Inflation Composite hovered close to the Fed’s “2% target” between 2010 through mid-2021, and then soared to a multi-decade high peaking at 6.6% in December 2022. Since then, the composite dropped down to a level of 4.4% where we are seeing a leveling off period. Why is inflation proving to be a much harder dragon to slay than some originally thought?
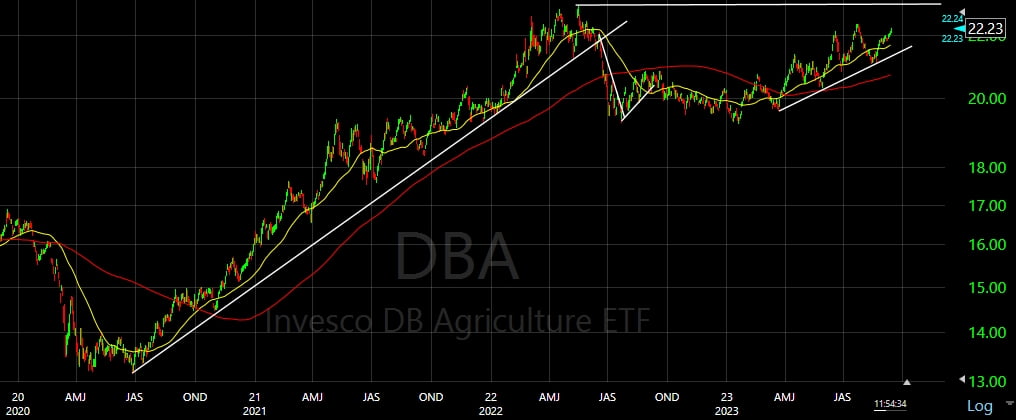
Agriculture: Agriculture prices, as depicted in this chart of the Invesco DB Agriculture ETF “DBA,” soared nearly +75% from Summer 2020 through Spring 2022. Prices then fell for the remainder of 2022 but have begun to rise again in 2023 and currently hover near their multi-year high, meaning Americans are paying more for food.
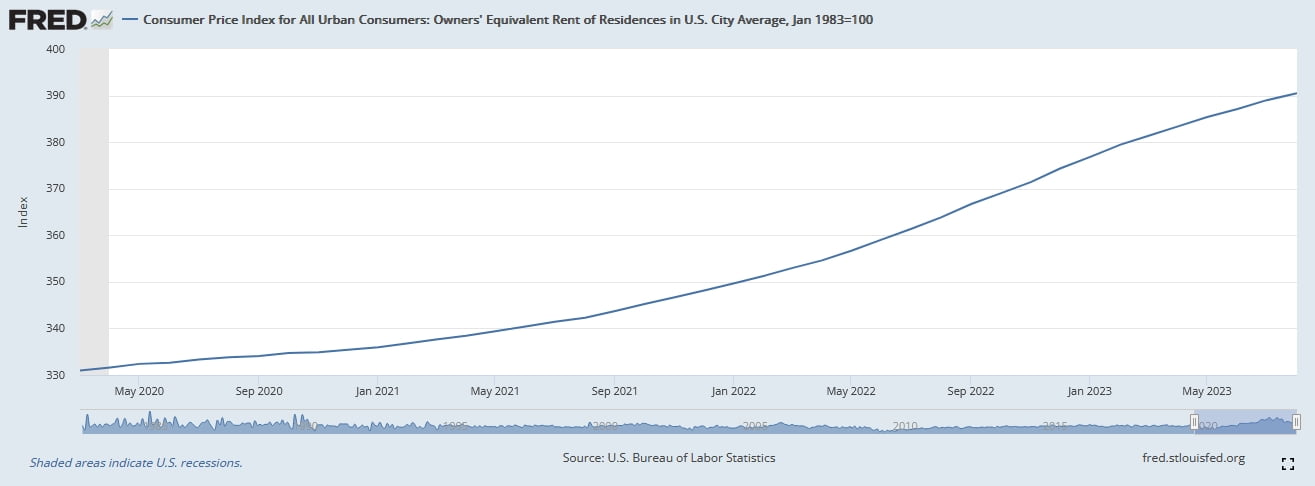
Shelter: According to the Bureau of Labor Statistics (BLS), the average American family spends 34% of their income on shelter, making it one of the largest monthly expenditures. This shelter cost, also known as “owners’ equivalent rent,” has increased over 18% since 2020.
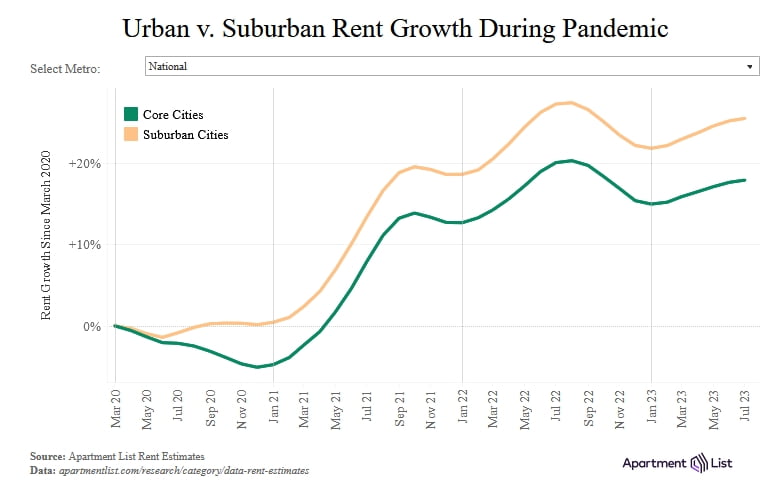
Worse, if you’re looking at moving to new digs, actual asking rents from landlords have rocketed even higher in the suburbs, rising +25% since COVID hit in early 2020.
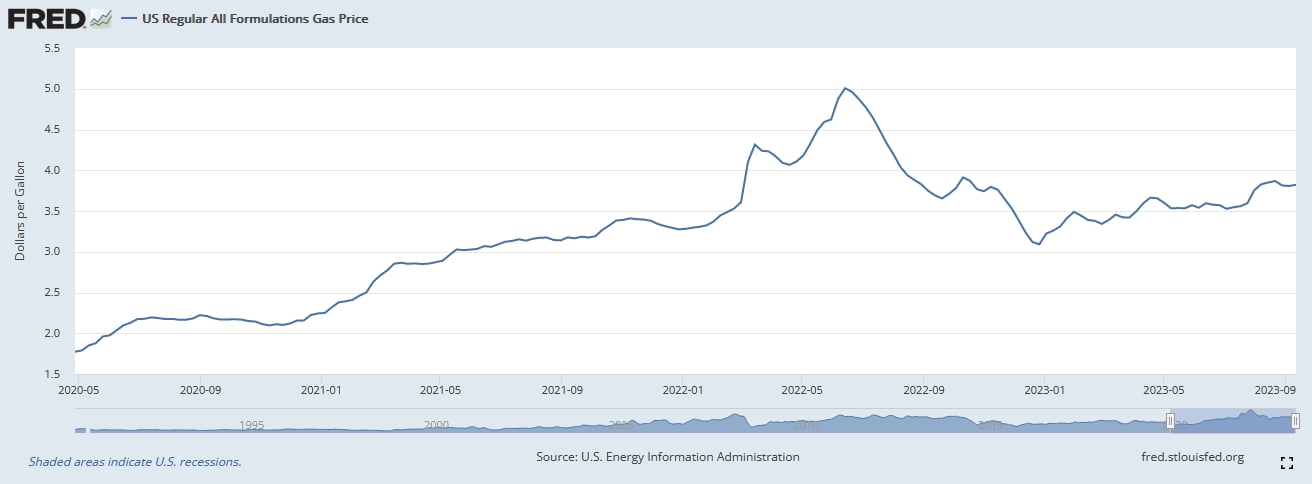
Gasoline: The current national average at the pump is $3.82 per gallon, up +116% from the bottom of the COVID panic. While the average is down from the peak in mid-2022, it has been rising steadily this year.
Summary: Food, shelter, and gasoline easily make up over half of an average household’s budget. Their rapid rise in the past few years will remain a strain on families going forward and they will be key factors in judging the Fed’s battle to slay the inflation dragon.