Headwinds Part I – UNEMPLOYMENT
With the advent of a new Administration coming in 2025, we thought it would be prudent to review some of the economic challenges they will face.
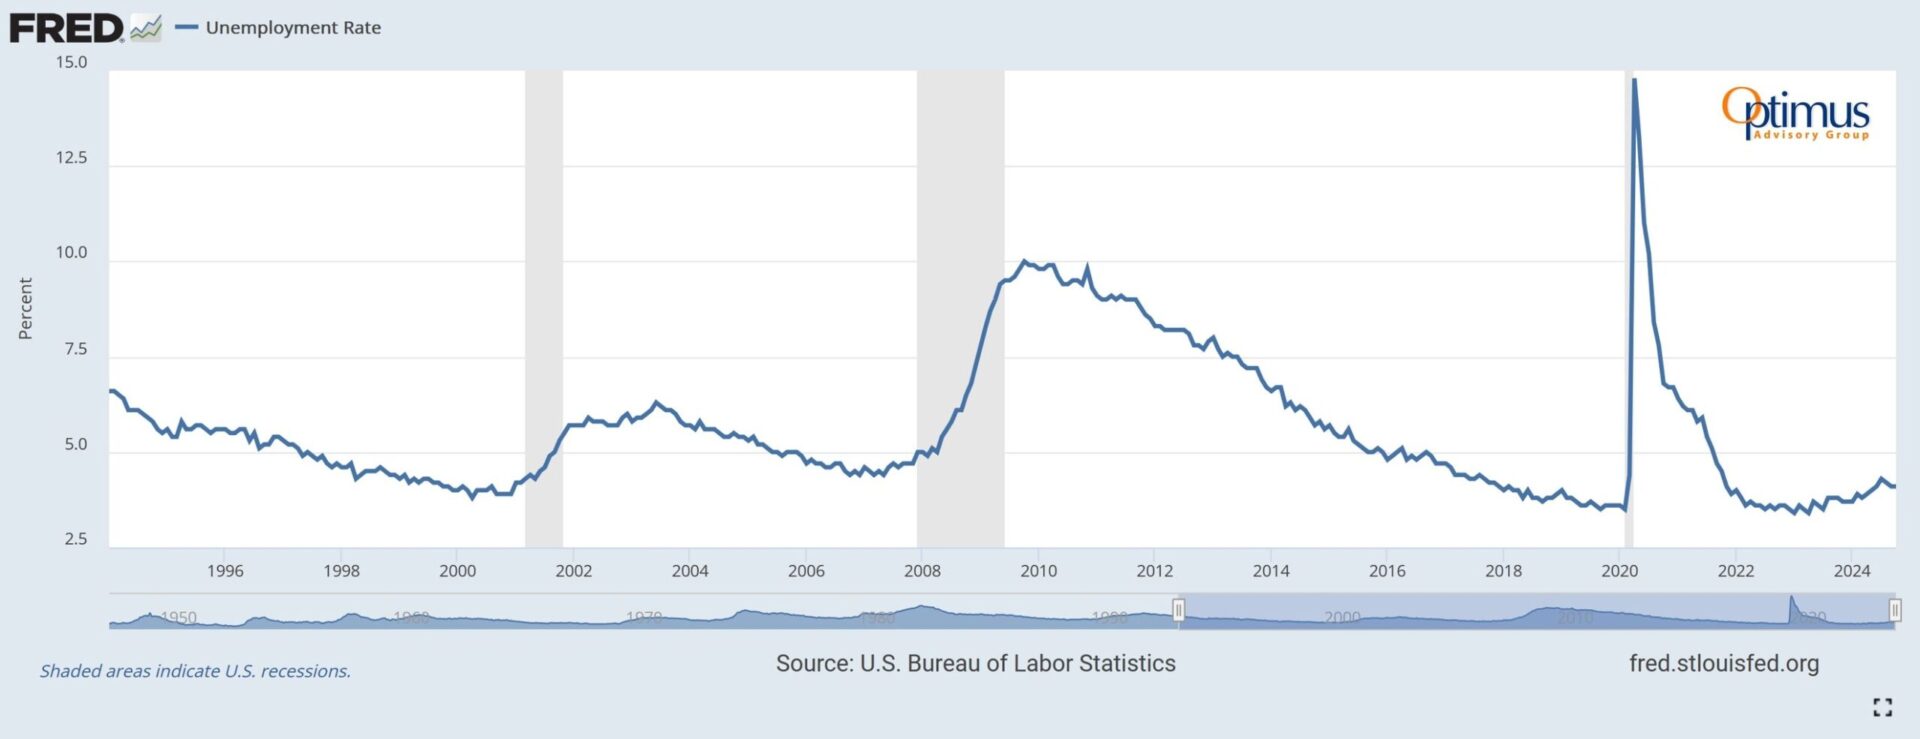
First up, for this multi-part series, is unemployment. We’re all familiar with the headline unemployment numbers posted each month, the data series is known as U-3.
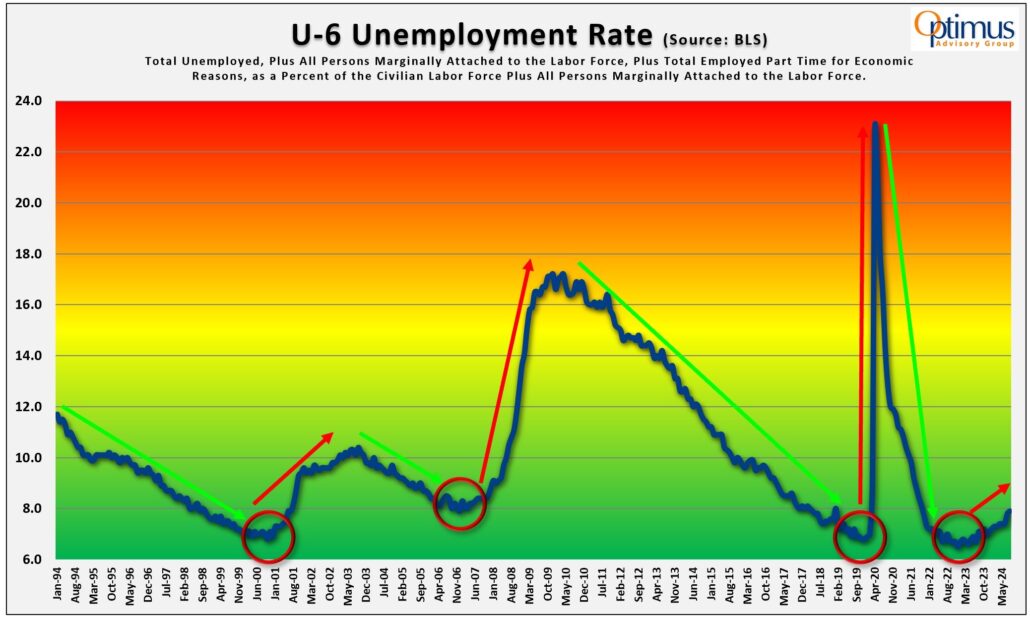
To get a more comprehensive view of the unemployment situation, let’s look at a broader measure known as U-6. Also reported by the U.S. Bureau of Labor Statistics, U-6 seeks to capture a multi-faceted look deep into our unemployment situation as it includes underemployed, marginally attached, and discouraged workers. It’s also the broadest measure of unemployment produced by the BLS.
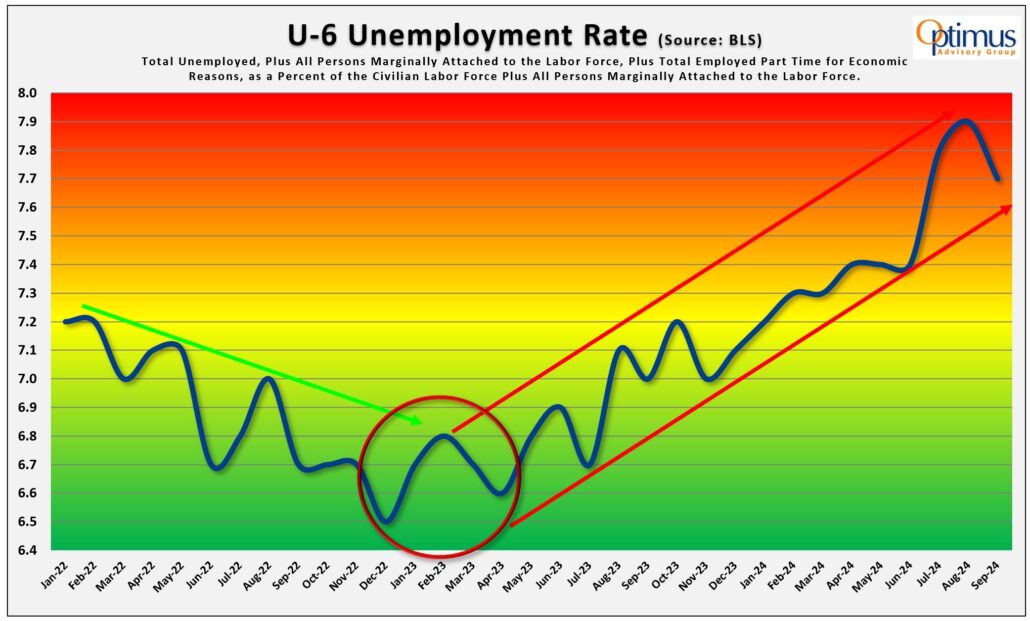
As marked by green lines, we can see periods of falling unemployment during strong economic growth, such as 1994-2000, 2003-2007, 2010-2019 and finally 2021-2023. Additionally, the red lines show spikes in unemployment rates from 2000-2002, 2007-2009, 2020 and since 2023. Let’s zoom in to see what’s happening recently.
Now we can appreciate just how pronounced the move up in U-6 has been since bottoming in late 2022 at 6.5%. This chart shows a nearly 2-year long steep incline in that rate, hitting a recent high of 7.9%.
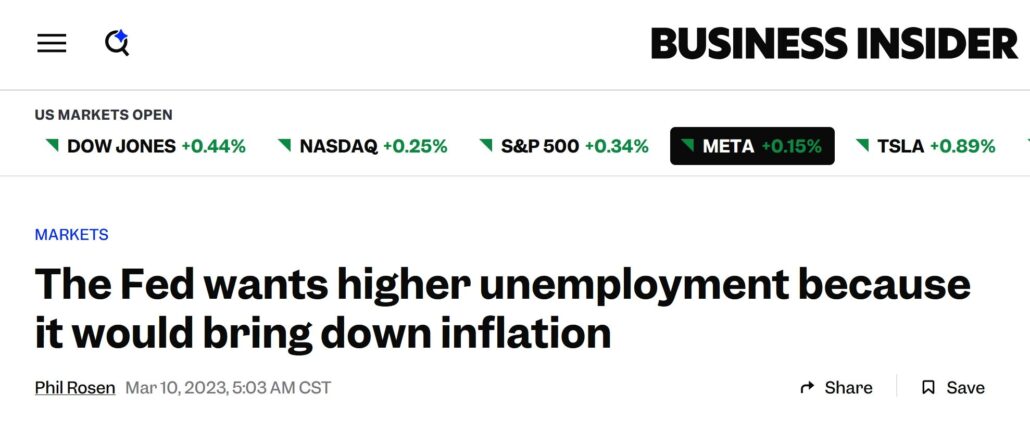
Remember back in 2023, Fed Chairman Powell mentioned he would need the unemployment rate to tick up more than a few bps to warrant multiple rate cuts? Well, the recent U-6 data may drive more rate cuts into 2025.
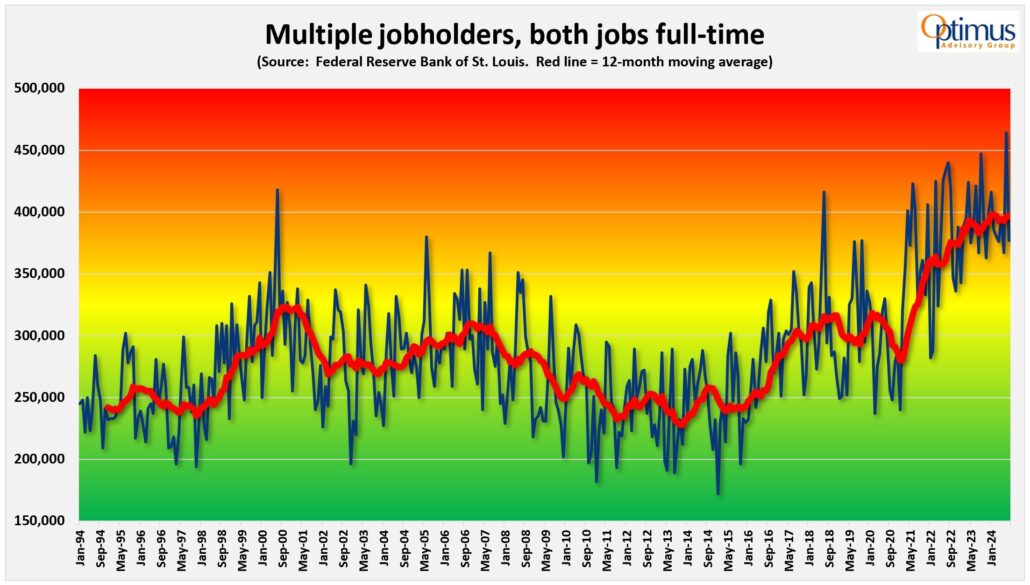
Next, we have a 30-year chart showing how many jobholders out there are working TWO full-time jobs. You don’t want to see a rising trend in this data series, as that would mean an ever-growing number of jobholders are stretched beyond a healthy limit. Unfortunately, this series bottomed out way back in 2013 and has only had two meaningful dips along its way to all-time highs. We’re going to need a steady stream of new high-paying employment opportunities to drop this back down to reasonable levels.
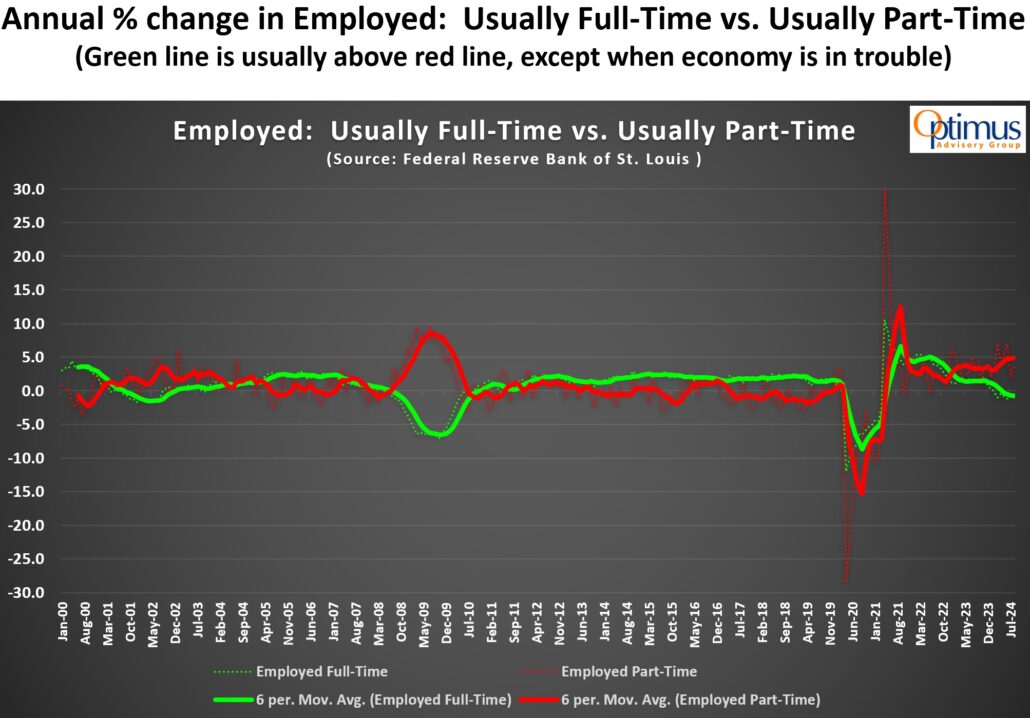
The above chart shows a comparison between those workers that usually work full-time (green) vs. those that usually work part-time (red). The red lines are usually only above the green lines during economic distress, as can be seen in the aftermath of the tech bubble bursting in 2001, during the financial crisis of 2008, and during the COVID crash in 2020. Presently, we see the red lines again overtaking the green lines all the way back starting in early 2023 and yet, we have no economic distress, at least on the surface. However, under the surface, something is seemingly not well with the US employment picture. Cracks are starting to appear.
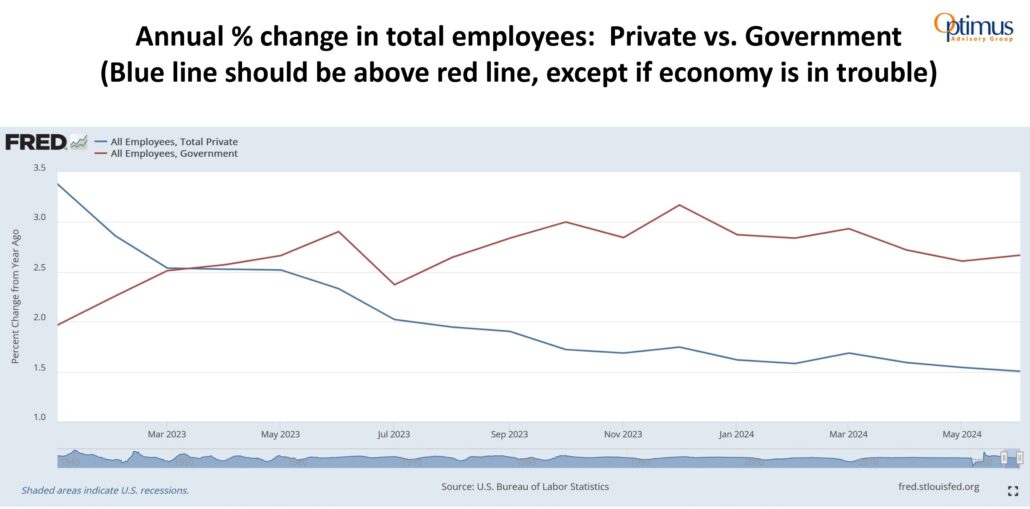
Which employment sector is growing fastest: Private or Public (Government)? Typically, when the economy is hitting on all cylinders, the blue line (Private jobs) is above the red line (Government jobs). Starting back in Spring 2023, however, the lines crossed and we see Government jobs (funded by taxpayers) rising and holding steady at a year-over-year growth rate of over 2.5%, while private sector hiring continues to fall. While this phenomenon is uncommon in times of economic expansion, it might be explained by the current budget deficit of nearly $2 trillion funding the surge in government jobs.
Expect this trend to continue as the Atlanta Fed has 4th quarter 2024 GDP running at a level of +2.5%. The question becomes what will happen to the economy if the new administration cuts back dramatically on deficit spending to try to reduce Government inefficiencies?
COVID Impact
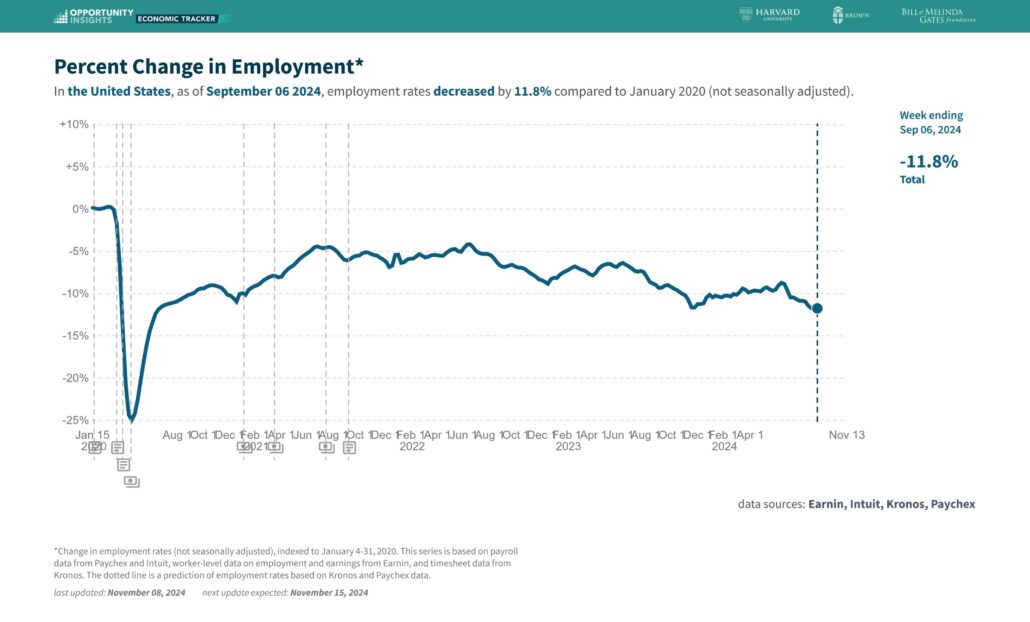
After the Bureau of Labor Statistics drastically reduced the number of new jobs previously estimated from March 2022-March 2023 by 818,000 jobs, one might feel the data isn’t as accurate as hoped for. So, we turned to data from a research consortium run by Harvard University, Brown University and the Bill & Melinda Gates Foundation. This research group has been tracking several economic indicators with the sole purpose of comparing current levels with January 2020, to establish how much damage COVID-19 lockdowns and countermeasures did to the economy.
We view this as a good barometer for small to medium sized businesses and their employment patterns because the researchers can obtain anonymous data from the likes of Intuit (QuickBooks, etc.) and Paychex (payroll service company). What this data shows is the employment picture for small/medium sized businesses is far from ideal. This large group of employers is showing a negative employment rate of -11.8% since January 2020 indicating that many companies in this group have downsized significantly post-COVID.
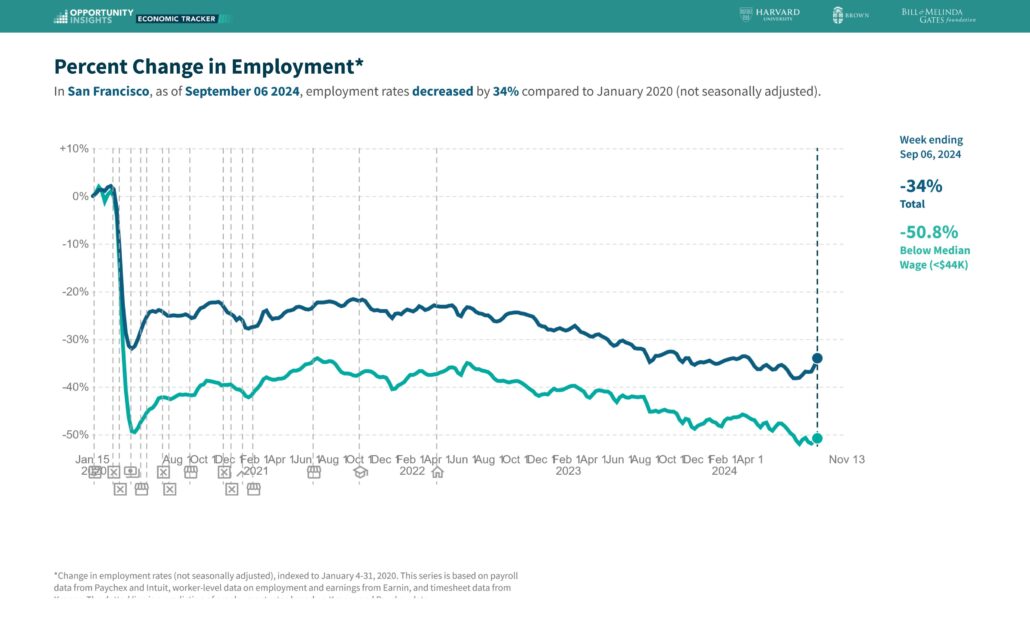
The most graphic example of how badly COVID-19 lockdowns damaged an entire metropolitan area is San Francisco, where employment among small and medium-sized businesses is down -34% since January 2020. Moreover, lower wage earners have seen employment for their group drop by -50.8%. Both levels are now unbelievably at or just below the lowest levels during the COVID crash.
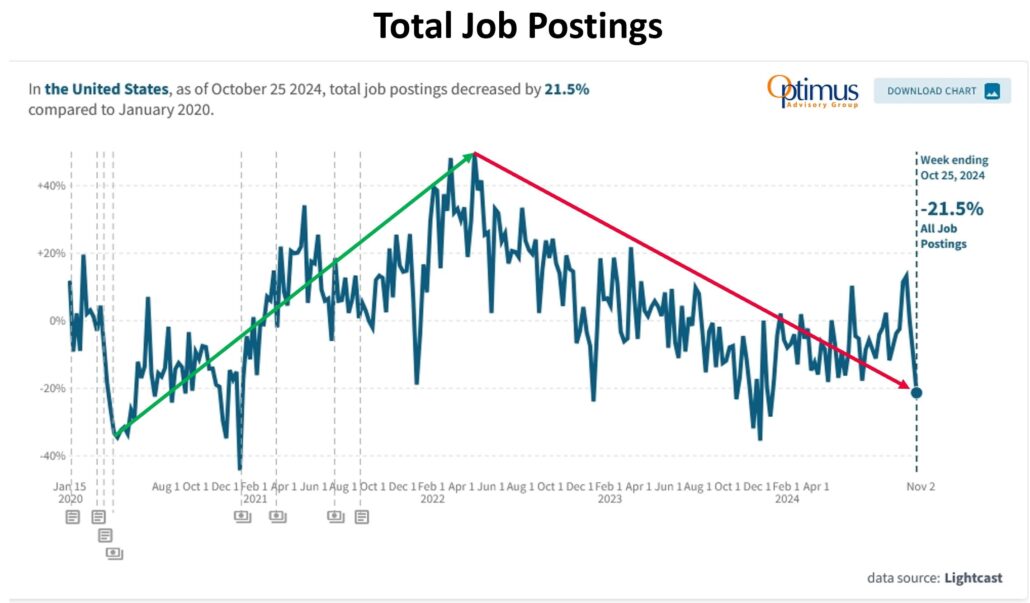
Looking at the U.S. as a whole, the number of current job postings is -22.5% lower than in January 2020, according to data provider Lightcast, the company that among other things tracks 2.5 billion global job postings and 400 million career profiles. This is also part of the ongoing research done for tracking the damage done to the labor market from COVID-19 restrictions.
Final thoughts: The current employment situation in the US has been weakening for quite some time. We believe that enormous deficit spending has kept the economy from suffering an economic slowdown that might have already materialized as far back as Summer 2023. Instead, we are left to wonder why, after the COVID response crashed the economy and we spent nearly $6 trillion in the two years between 2020 & 2021, we were able to cut deficit spending in 2022 to “only” $1.4 trillion, only to see the next two years’ numbers balloon to $1.7 trillion & $1.8 trillion respectively. Pivoting from that level of overspending to an attempt to cut Government waste starting in January 2025 might be quite a shock to our economy. The next Administration has a monumental task ahead of them. We can only hope they perform the critical balancing act between radical spending cuts countered with boosting economic output and tax/tariff revenues.
If you’d like more insights and guidance on how to navigate this new post-election world for your clients, please contact us.


